

On marketing and price elasticity - QN#19


There is an ongoing debate about marketing’s role in price elasticity. Opinions range from ignoring it completely to viewing it as the main goal of building a brand. We covered this in QN16 where we featured Google’s “Effectiveness Equation”.
Indeed one of the greatest advantages of having a strong brand is the ability to charge higher prices and see how your demand gets little impacted, or being more resilient to price changes.
However, this topic can get technical, and it’s easy to confuse the terms. Remember that price elasticity already measures sensitivity to price variations. So, when we say “good marketing decreases price elasticity,” we are technically talking about a variation of a variation.
Why does this matter? To clear things up, let’s look at a hypothetical scenario. The actual numbers don’t count; it’s just for the sake of the argument.
A product that sells currently 100 units for 10€
3 scenarios of elasticity: Price elasticity of -0.8 (inelastic) and -1.2 (elastic) and -2.5 (very elastic)
COGS 2€ per unit on “high margin scenario” vs. 8€ per unit on “low margin scenario”
With those datapoints, how do revenue and profit change if we apply the usual pricing elasticity formulas?
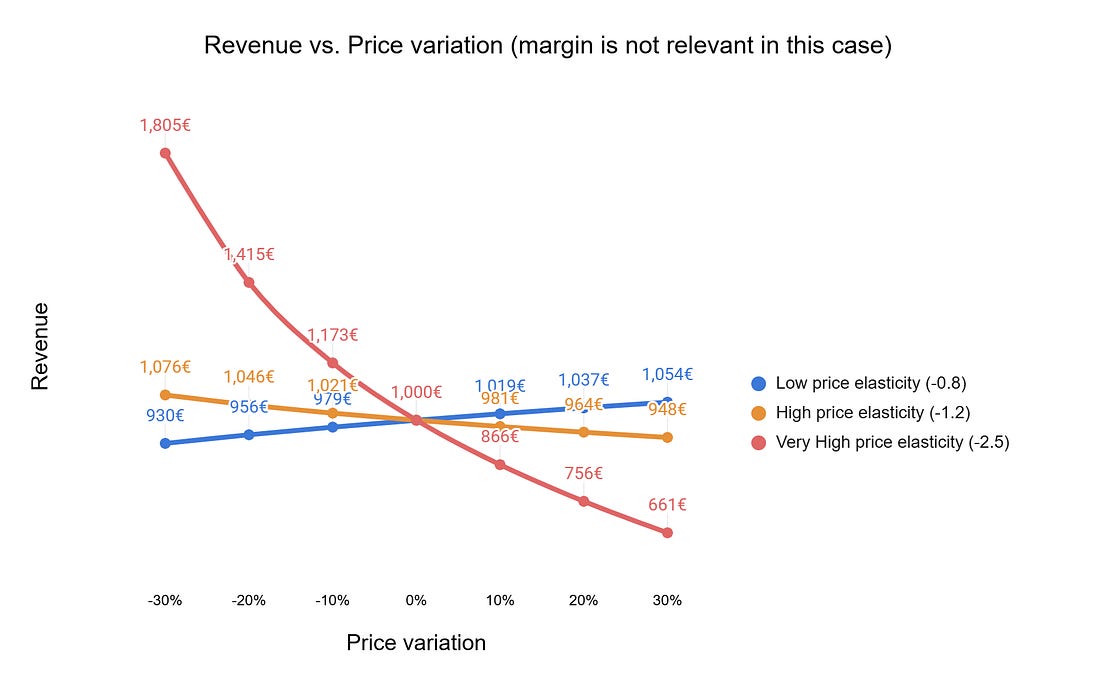
Let’s start with the revenue. In this case there are only 3 possibilities as the margin is irrelevant. The chart is absolutely predictable and determined by the elastic-inelastic starting situation. Elastic brands decrease revenue if they price up, inelastic brands increase revenue. That’s it.
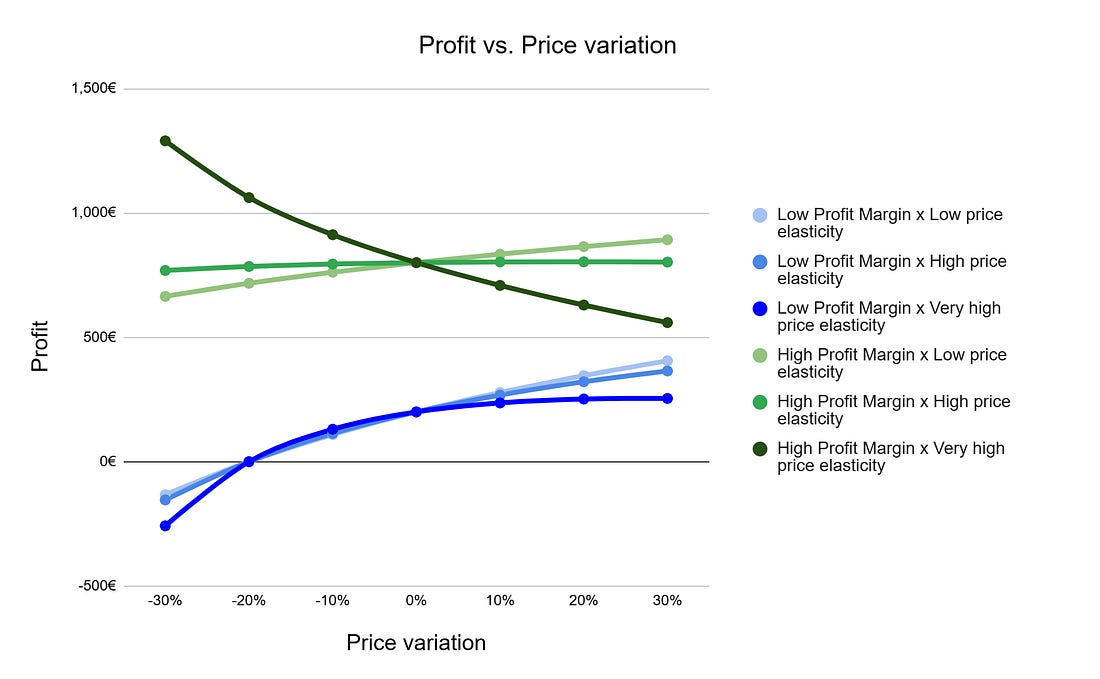
When we look at profit the situation gets more nuanced.
We see that for low profit margin (blue) actually the impact that the different price elasticity could have is minimal.
On high margin scenarios (green) the different price elasticities can shape the outcome. Around an elasticity of -1 there's more to gain or lose, it's a "flatish" line. That's true for elasticities around abs(-1.2 to -1.5). If elasciticy is higher than abs(-2), then increasing prices at high margins is not a good idea.
What does this mean in practical terms?
For those scenarios with low margins, raising prices is a critical decision and will deliver profit increases even if at the cost of revenue. Just consider raising prices to get out of the profitability trap and worry less about elasticity. In this situation, the literature on how marketing changes elasticity is secondary.
But that’s only the beginning. You should wonder… “why am I in that bad situation of low margins?”. Kantar BluePrint for Growth would say “because you did not have enough pricing power”. In a way, by not having invested into a strong brand you got yourself into that profitability problem. Marketing alone and its power on shaping the elasticity curve won’t solve your short term issues, just take the hit and increase prices. They key is that you reinvest those extra profit into brand-building activities to strenghen your position in the future.
For those scenarios with high margins, then the relationship of marketing with price elasticity are of upmost importance. This comes to the details and each company should do the maths themselves.
Generally speaking, if the elasticity is low (inelastic of low values of elastic) there is more freedom to play along the pricing curve to become a more mass or more niche brand, while keeping profit more or less similar.
If your pricing elasticity is very high and your margin is high too, since you are already making a lot of money on every product sold, increasing prices won't pay off in terms of profit (the revenue loss will dominate). In that case, the most sustainable decision would be to invest in marketing in order to decrease your price elasticity and then increase prices.
Side note: price elasticity is as complex metric from a mathematical standpoint, it’s not as simple as it looks like from the conceptual POV. For example, it should not be confused with the derivative of the revenue vs. pricing graph! For the calculations of this newsletter we used the "midpoint elasticity" formulas. Other definitions like the “Point elasticity” are even tricker in math treatment, as they are not even symmetrical.
Industry Updates
NNN: Next-Generation Neural Networks for Marketing Measurement
A radical new approach on methodologies, absolutely worth reading even if it will take time to materialize, if it ever does. Fascinating because it applies some of the techniques that enabled the GenAI revolution into the MMM world.
In particular:
Attention (as understood in the LLM world, not in the advertising attention world) as a substitute of fixed adstock decay rates
Unlike traditional MMMs that only use scalar inputs (e.g., $100k TV spend), NNN uses embeddings to represent qualitative data including ad creatives or search queries, both to distinguish “good” and “bad” impressions or investment
The model is “nested” because it explicitly learns the causal chain from marketing investment to demand estimated by search queries to finally sales
Of course all comes with some concerns, but those do not undermine the value of this paper and how we should reflect about it. In terms of concerns these could be:
Overkilling with top-notch models the already very constrained datasets that source MMM (the 3 years x 52 weeks points). Overfitting?
Loss of interpretability. MMM inputs like impressions/GRPs/spend are not only practical because it’s the data that it’s available, it’s also practical because it’s they way that marketers can act upon the results.
Creative is an input or an output in a model? Both could be argued.
If we were to compare it with Meridian, NNN would be an “experimental” approach, it requires large amounts of data to work effectively and is a “black box”, harder to explain why it made a prediction. Potentially, it would be a good solution for savvy brands with large amounts of unstructured data like ad creative visuals and search queries data.
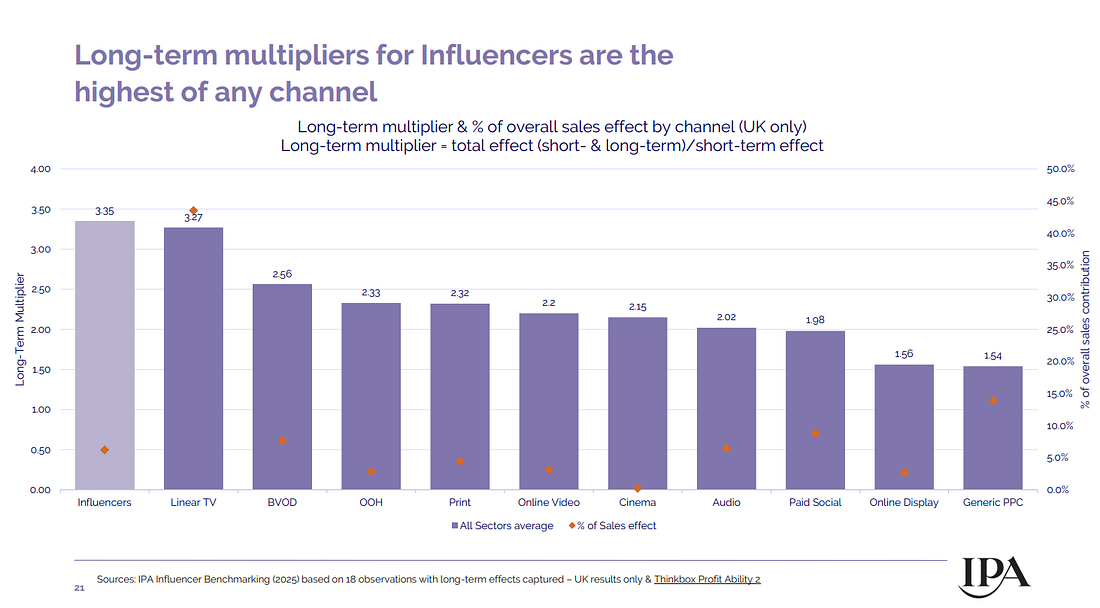
IPA study on Influencer ROI
The IPA has published a meta-analysis of influencer campaign results based on MMM across different countries. The full report can be read here. Note that even though the IPA is based in the UK, this analysis includes a mix of 220 cases across a variety of countries.
In general terms, the channel overall behaves very close to the average, with better results on Telco and SkinCare categories.
When long-term effects are included, the channel achieves a 151 ROI index vs. the average, which is equivalent to a 3x long term multiplier. However, it’s important to note that this is based on a subset of 18 observations out of the 220 of the database, because measuring long-term is something still unusual in MMM projects.
Give the nature of the channel, there is some unpredictability. Media optimisation parameters don’t clearly predict results. On the other side, there is a small % of campaigns that delivern an exceptional ROI, meaning that potencially there’s a jackpot to be won if the right influencer, topic, execution, virality… gets into place.
Google Analytics Reporting Playbook
Without any doubt, the previous version of Google Analytics (Universal) gave users confidence about their data. Consent modeling (or modeling in general) did not exist, sampling was “simple”, reports were predefined, BigQuery export had very similar data to the interface or the API and it was a continuation of the earlier Google Analytics versions (some folks might remember remember the “Classic” version).
This is not the case today. Modeling is required today to understand user behavior, aggregated data is a very valuable asset which is not exported to BigQuery, behavioral and advertising data requires separation, explore reports give the granularity but standard reports use preloaded tables which can be customized for ongoing needs. The list of reporting differences between Universal and GA4 is long and has been evolving over time. While you can stay complaining that GA4 does not work like Universal, it is a much smarter approach to embrace and learn how reporting works today in Google Analytics. The measurement world is much complex it used to be and reporting in Google Analytics is a reflection of such evolution.
The Google Analytics product team has launched this resource which requires reading, study, practice and circle back to ensure you make the most of it. The Google Analytics Reporting Playbook provides a comprehensive overview of all reporting surfaces in Google Analytics.

Reports, Explore, Advertising, Data API and BigQuery export have unique features that require understanding their distinct features to know where to look for insights, whether you are analyzing user behavior across your website or app, or measuring the performance of a marketing channel.
This playbook includes detailed sections on each of these areas, as well as dedicated information on Audiences, Case Studies, Common Questions, and Reporting Gotchas.
This is already an essential resource for everyone relying on Google Analytics to understand their business.
Download, print and take it with you. It’s really worth the time.
Incrementality and Retail Media: IAB guidelines
Retail Media is one of the big winners in 2025 in marketing spend growth, outpacing general digital ad growth, and becoming a core channel as brands shift budgets for its high-ROI, first-party data and availability of conversion reports.
The IAB has published its Guidelines for Incremental Measurement in Commerce Media which makes an effort to provide a common language for the industry’s most confusing metric. This report is essential because it legitimizes a pragmatic approach to measurement, moving beyond the obsession with “perfect” data.
The core conclusion is “Fitness for Purpose.” The guidelines explicitly state that you don’t need academic-level rigor for every single decision:
For high-stakes strategy: Use strong causal methods (like Geo holdouts or MMM) when allocating budgets or proving ROI to the C-suite.
For daily optimization: Lighter proxies are acceptable. When tuning a live campaign, speed often outweighs precision.
Crucially, the report draws a hard line: ROAS is an efficiency metric, not a proof of impact. If you are tired of circular debates where “Attribution” is confused with “Incrementality,” this document is a great resource you should point to.
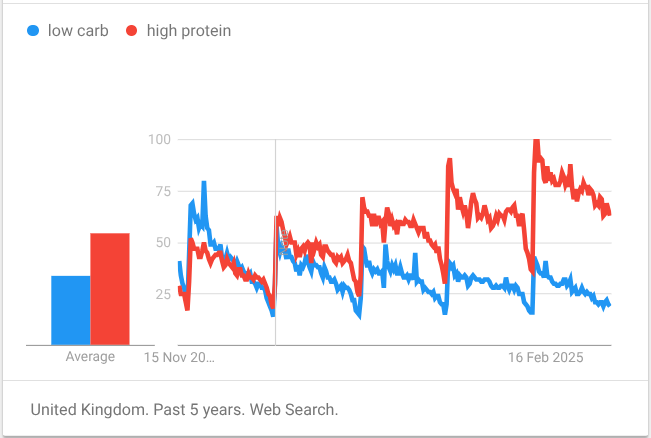
Chart of the week
New Year is coming and with it, habit change resolutions. How well do they fare as the months pass by? I think we all know the truth, and this Google Trends chart shows it:
Oldies but goldies
The Long-Term Impact of Promotion and Advertising on Consumer Brand Choice
Since we are discussing how marketing shapes price elasticity, we have to look back at this classic from the Journal of Marketing Research, published in 1997. Mela, Gupta, and Lehmann analyzed over 8 years of data to answer a critical question: Do our marketing actions change how consumers react to price over the long run?
Their findings are the scientific backbone of today’s newsletter:
Advertising reduces price sensitivity: Consistent advertising helps brands differentiate themselves, making consumers less sensitive to price changes (inelastic).
Promotions increase price sensitivity: Reliance on price cuts trains consumers to wait for the “deal,” making them more sensitive to price (elastic).
It’s a powerful reminder that while a price cut might win the quarter, it will slowly break your brand pricing power forever.