

Let's talk about frequency - QN#20


The debate on “optimal frequency” has been constant in media circles over the decades. Everyone has some kind of opinion, some companies have well-established traditions¹ and rules of thumb, often with obscure or untraceable origins.
Seeing some recent conversations on the topic (summarized here by Koen Pauwels) there’s a great deal of apparently contradicting claims. Where’s the truth?
Our thesis is that the reach/frequency question has some inherent technical complexities and nuances that make arriving at a “truth” difficult. However, much of the messiness of the conversation and the difficulty to see a clear picture comes from confusion in terms, mixing of concepts…
The right language is the first step towards a common understanding. Let us explain the different aspects of this topic from several perspectives.
Fair warning: this is a longer read than usual, but the topic deserves it!
The definition of terms and its convention
Consumers receive advertising impacts: that’s the object of our study. But of course not all impacts are the same, so we can start grouping them according to different characteristics.
One way of doing that is dividing them into reach vs. frequency impacts. What impact counts as “reach” and what impact counts as “frequency” is based on convention. Of course reach means 1st impact and frequency are subsequent impacts, but the specifics of what that means will depend on:
The time dimension: reach/frequency can be calculated at the day, week, month or campaign level. The longer the periods, the more the balance tilts towards frequency.
The same goes for channels. Because it’s so difficult to measure cross-channel, often reach/frequency get reported (or talked about) in isolation or as aggregation of similar channels—it’s not usually a comprehensive cross-channel measure.
Making those explicit and clear is our first recommendation.
What do we mean by “optimal”?
This is the second term where we need to be explicit and precise on the meaning.
Naturally, the question the business asks is “what’s the optimal frequency?” Fair question, but totally incomplete. What do we mean by “optimal”?
Maximizing the ROI for a given spend?
Maximizing the topline revenue if we change the spend?
Having a campaign that is big enough to measure an impact (more or less sophisticated)?
Optimal for a channel? For a campaign?
All proper conversations should have crystal clarity on what we mean. Most often, that’s not the case.
A good analyst is the one that helps the business ask the right questions. This is a great opportunity.
Surfacing the apparent contradiction
Many apparent contradictions could be solved by a proper definition of these aspects.
What is “optimal” for driving the mass of a business (effectiveness) is totally different from what is “optimal” to drive the ROI of a given spend (efficiency).
We often see reports advocating for higher frequencies because they take a stance of maximizing effectiveness, which is 99% of times the right approach and what business cares about. That’s mostly the case for those advertising channels where media buyers may be too shy on investment: often these channels can still absorb significant amounts of investment at a marginal ROI bigger than the average ROI of cross-channel. In that case, there’s a clear effectiveness argument to be made and a higher frequency is just the consequence of that.
Is that all? Not really, there’s something more profound on these macro recommendations and frequency vs. the consumer reality.
Also, we’ve been told for years by people at the Ehrenberg-Bass Institute that we should be maximizing reach. Why all this talk on frequency now? How does it all square?
A simple consumer model
This topic can get messy really quick because it has so many elements: media planning, media costs, consumer behaviour, measurement challenges…
What we see in macro observations in A/B testing or MMM has to be consistent with the aggregated behaviour of individual consumers. After all, it’s about consumers that this is all about.
A good intellectual approach is to think of single consumers first, as aggregation of consumers should have consistent behaviours unless we are ready to accept “circles upon circles” arguments such as network effects or similar “emergent behaviours”². Also, simplicity can be a great starting point and we can always add complexity later.
In other words, any insight that we get from analyzing macro data that can’t be explained in simple consumer terms should be taken with suspicion.
Let’s start with a very simple mental model. Let’s say all consumers have equal predisposition towards buying a brand, have similar media consumption patterns… Let’s dream that a media planner could decide who sees the advertisement. Big assumptions, but helpful for the exercise.
Then we deliver our 1st advertising contact. It would not matter who receives it since consumers are homogeneous, so no decision is to be made.
Then our 2nd contact—who should you deliver it to?
This is the fundamental question.
One could have different opinions. From the data we have seen in our careers, data collected doing proper brand lift meta-analysis while controlling all the variables, the optimal is to deliver the message to a new person.
You reader may have doubts on this or have seen other kinds of data, but let’s do a “reductio ad absurdum”: If you are a believer in giving a 2nd contact to the same person—what if it was 5, 10 or 15 impacts, would you do the same? Feels weird, right?
All of us would agree that 100 contacts to 1 person is worse than 1 contact to 100 people.
The problem is on the grey area: 20 contacts to 5 people, 5 contacts to 20 people or 1 contact to 100 people? Any answer different from the last one implies that there is some kind of “tipping point” in consumer decisions.
Is it reasonable to think of tipping points? In other words: is there a number of contacts where consumers don’t have any advertising impact and suddenly there’s a threshold where they will certainly buy our product?
Of course not: what every advertising impact does is to increase the probabilities of a purchase. There’s no tipping point, but rather an accumulation of higher probability as we increment the frequency.
Consequently: it’s clear the 1st impact is the best one, and an ideal scenario would maximize the number of “1st time impacts” vs. any other option.
Limitations of this model
As in all model representations, they hold vs. reality as long as some conditions are met. Several phenomena could break our assumptions:
Consumers have different predispositions to consume certain brands. This makes reaching some people more valuable than reaching others. This is due to fluffy “segmentation-affinity” effects, but there are also hard elements, like heterogeneous distribution of a product.
People have different media consumption patterns. This introduces a cost efficiency element into the planning.
Advertising delivery has frictions: one does not go 1:1 with every single consumer but often impacts several at the same time (think TV, outdoor…), there’s never perfect information on who is behind the screen, friction between the planning and the execution of a campaign…
All these elements are true and that’s what justifies the need for sophistication in planning. But they can’t be above the fundamental truth that the 1st impact is the best.
More is more, but how much more?
But we do keep on seeing charts that say that higher frequencies drive more business. How come?
Of course a frequency of 3 produces bigger results than a frequency of 1. But our role in optimization is: what’s the better alternative?
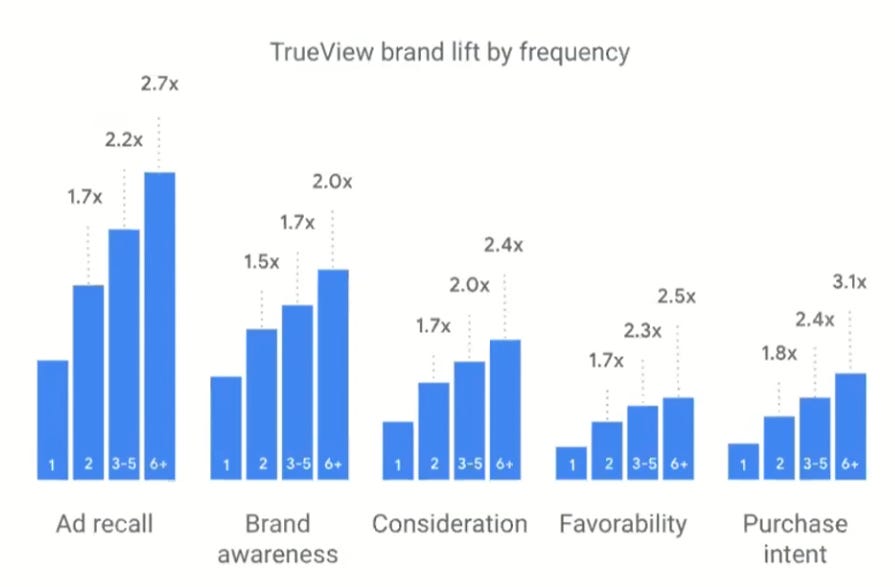
YouTube’s BrandLift database is probably the best in the world for these matters: massive sample per experiment, proper test-control designs of the cells, a limited number but constant set of KPIs, thousands and thousands of cases… and most importantly: metadata on execution levels.
Google published data from that database in 2017, which can still be found here or in this presentation. We have no reason to think that these insights have changed significantly.
What do we see in the chart? The most important numbers are those 1.5 to 1.8 indexes for the 2nd impact: it’s always less than 2x. The first impact is the best, the second delivers always less. Same goes with the subsequent ones.
This extremely high quality data proves exactly what we discussed in the previous point.
(See minute 16 of this presentation)
An apparent paradox
How can the F=1 be the best impact and many of the papers going out today say that it’s better to have F=3 or higher?
This is a consequence of media planning. It does not mean you should be optimizing for F=3 at the expense of reach!
In reality, you can’t decide to build exclusively reach or frequency. Reach and frequency are being built simultaneously, in a stronger or weaker way depending on your media planning capabilities (frequency capping, smart scheduling of TV insertions, smart combination of different platforms…).
Saying that a business is better off by having a frequency of 3 in an underinvested channel with great ROI (vs. putting the money in other channels with lower ROI) is absolutely right and true. It’s just that the point is that the underinvested channel deserves more, and if higher frequency is the consequence, so be it.
On the measurement precision limitations
Do not let the technical limitations of aggregated models (such as MMM) be inconsistent with real consumer behaviour.
From what we said before, it follows that an S-Shaped curve ultimately contradicts the consumer behaviour model we described earlier. But not only: it also contradicts the BrandLift data we have.
Simple explanations are often the right ones. Let’s not be forced to increase the complexity of the consumer model if the simplest explanation is that aggregated models such as MMM struggle to properly measure low media execution levels.
Most often the S-curve is explained as “first you don’t see a lot of impact because there’s not enough consumers impacted by the investment, then you see it ramp up, eventually there’s diminishing returns.” Easy to understand but not true to reality: the earlier stages of the media investment do deliver value too—actually it’s likely that they deliver the most value. It’s just that we can’t properly measure because of the low signal-to-noise ratio.
The S-curve is a reflection of our limitations of measurement.
Reflecting these into modeling
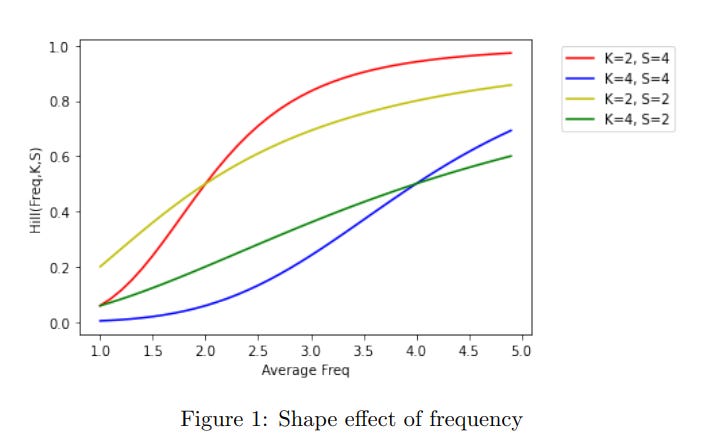
Most often, what goes into the models is a Hill function, be it on total impacts (traditionally) or on some subset of the impacts (such as in Meridian, which has linear assumptions on reach and Hill function for frequency).
This is how a Hill function looks like. Note there are two parameters (K and S in this case). Here we have created a simple Gemini Canvas interactive tool to play around.
For the sake of this topic, we care about the S parameter. Any value >1 would mean some degree of S-Curve behaviour, while <1 would get us a classical diminishing returns curve.
It is our view that values <1 are the only ones that are consistent with true human behaviour.
(From the Google Meridian R&F paper)
A proposition
So, how do we move forward in practice?
Modern media measurement is all about combining different data sources and methods to give the best answer. You all know about calibration of MMM using A/B test data.
Following this approach: what if we incorporated brand-lift results of frequency by level as priors to the Meridian model for the K and S parameters?
Seems like a good way forward.
Industry Updates
Mark Ritson end of year reflections
Resist the push to make predictions, better approach to reflect on the current events. #1 is about pricing, have a look at QN19 where we talk about it.
IPA Effectiveness Awards 2026 opens with a new paradigm
The IPA Effectiveness Awards 2026 are now open for entries, with a notable shift in focus. As Charlie Ebdy from Omnicom Media Group UK notes, “the advertising industry’s shift toward digital media has outpaced its ability to prove effectiveness.” The Awards are evolving to meet this challenge, with early registration closing January 9th. This year’s theme asks a fundamental question: do digital ads really work? A timely reminder that effectiveness proof remains the industry’s biggest challenge. More details here.
Google Meridian adds pricing and promotion variables
Google’s open-source MMM framework Meridian received a significant update in late 2025, now including non-media variables like pricing and promotions, channel-level contribution priors, and enhanced binomial adstock decay. For those of us working with reach and frequency modeling, the enhanced priors capability is particularly relevant—it opens the door to the kind of calibration we discussed in this edition. Read more.
Ad Age: Metrics that will matter most in 2026
Ad Age’s annual forecast highlights incrementality and attention as the metrics to watch this year. The report notes a shift away from traditional impression-based measurement toward proving actual business impact—a theme that resonates deeply with this edition’s discussion on frequency. As the industry matures, expect more scrutiny on whether those extra impressions actually drive incremental value. Full article.
Chart of the week
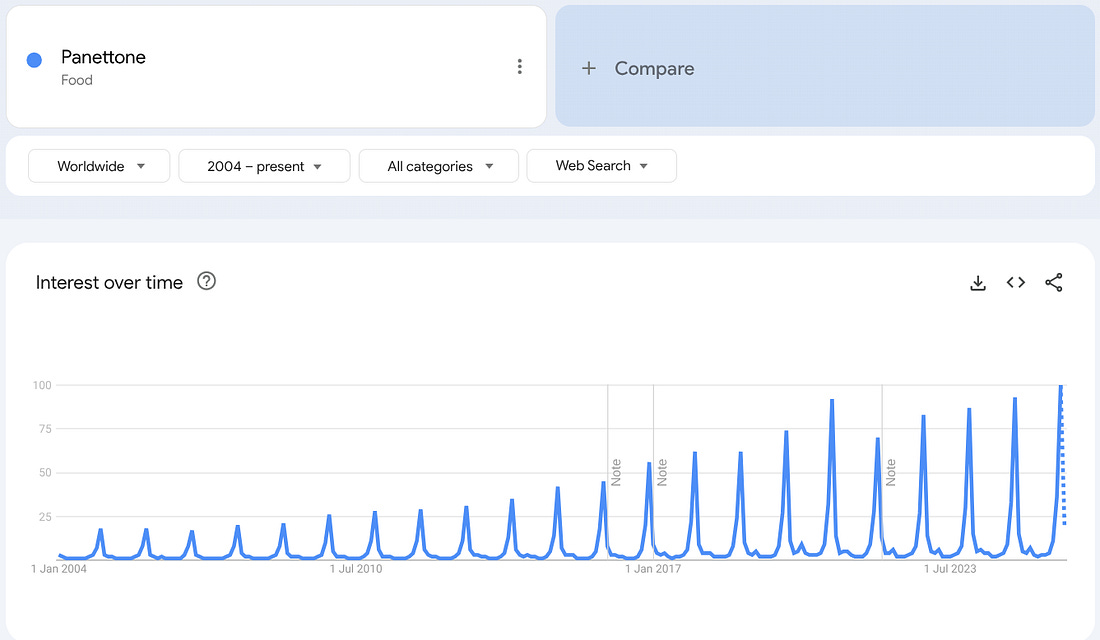
Christmas is over and surely you have been tempted with some sweet delicacies. There’s one Italian export that has been increasingly popular on all shelves.
Have we reached “peak Panettone” yet? Apparently not: yet another year with record interest in this product.
Oldies but goldies
Erwin Ephron and Recency Planning
Before his passing in 2014, Erwin Ephron was perhaps the most influential media planning thinker of the modern era. His 1995 concept of “Recency Planning” fundamentally challenged the industry’s obsession with frequency thresholds.
The conventional wisdom of the time—rooted in Herbert Krugman’s “three-hit theory” from the 1970s—held that consumers needed multiple exposures before advertising could work. Media plans were optimized for “effective frequency,” often targeting 3+ exposures per person.
Ephron turned this on its head. His argument was elegantly simple: advertising works by reminding people who are already in the market. Since you never know when a consumer will be ready to buy, the best strategy is to be there continuously—to maximize the probability of reaching someone at the right moment. Reach, not frequency, should be the priority.
As Ephron put it: “One exposure is not a waste. It’s all you need to remind a person who is ready to hear.”
His 1997 paper “Recency Planning“ remains essential reading. It anticipated by decades the debates we’re still having today about the diminishing returns of frequency and the primacy of the first impression.
The irony? Thirty years later, with infinitely more data and computing power, we’re still fighting the same battle Ephron won on paper. Perhaps it’s time to re-read the original.
The choice of the term "tradition" is done on purpose: ways of doing that are embedded in organizations, accepted and not challenged, but they are hard to track in terms of origins. They are a social consensus and a way of operating.
The only “emergent” behaviour that we think could be reasonable to accept is some kind of amplified impact of having seen the same campaign (with its iconic assets, recognizable patterns, consistent idea…) in different media. That exposure of the same idea in different contexts could potentially have some multiplier benefits. However, we have not seen that effect properly measured at the individual level (besides the usual MMM stats on “synergies”). Also they are inherently a cross-channel conversation and frequency is already a hard-enough topic if we talk on single channel.