QN#9 Frequentists vs Bayesians and Marketing Science
Science! There are marketing/data scientists out there, lifting their swords and shouting loud: “Priors are an essential piece to understand the probability of an event!”
You can hear others, saying much louder “p-value is the metric to look at!”
When we look back at how marketing science has been developed, it has been mostly by people having beliefs which are backed by data and then become truth. It has also been about taking pieces from statistics, machine learning or artificial intelligence in general and make it work to serve the needs of the marketer.
A beauty of science happens when there are different approaches for solving similar problems. This gets more exciting when these are rooted in different philosophical foundations. Which (likely) different outcomes to trust? Moreover, who should care about this? We believe it is not only the marketing/data scientist who must own this knowledge. Everyone who wants to ensure their marketing initiatives have a business impact requires a minimum knowledge on statistics and data analysis, also on some of its foundations. Let’s see the main points here:
Frequentists would agree with Aristotle when he said “the probable is that which for the most part happens”. That is, the idea of the most frequent event when the phenomenon happens many times. This is more useful on repeated events over time such as predicting if a user will click on a button or not. Central to this idea is the concept of null and alternative hypotheses, for example to determine whether the observed effects of a marketing campaign are statistically significant on the desired KPI. It use p-values to assess the strength of the results with a confidence interval as a measure of precision.
Bayesians would see a prediction or the probability of a success as a reasonable expectation, or as a quantification of a belief. It incorporates prior knowledge and evidence into the analysis. As new data is introduced, the prior distribution is updated to form the posterior distribution, which would be a better prediction. It also provides credible intervals, which are a direct probability statement about the parameter.
The difference between the confidence interval from the frequentists and the credible interval from the bayesians is worth looking deeper. Let’s see it with an example:
Imagine you're trying to predict the future success of a new marketing campaign. Using a frequentist approach, you get a report (confidence interval) that says, "If you were to run this campaign for the next 100 days, 95 of those dies, the conversion rate will fall within this range." It's a prediction based on repeated, long-term averages. On the other hand, a Bayesian approach gives you a different report (credible interval) that states, "Given our prior knowledge of similar campaigns and current data, there's a 95% chance the conversion rate will fall within this range for this specific campaign." This method continually updates with new data, providing a more tailored and immediate insight based on all available information.
Both approaches aim to extract meaningful insights from data and provide a framework for making inferences. Neither has a monopoly on truth, and the "correct" approach depends on the specific question being asked and the priorities of the analysis. There are situations where frequentist methods might be more suitable (e.g., well-defined experiments with large sample sizes) and others where bayesian methods excel (e.g., complex models with smaller sample sizes or decision-making under uncertainty).
Let's see how each approach would apply to a broader marketing challenge: understanding the relationship between advertising spend and sales.
The Scenario: Quantifying Marketing Impact
Imagine you've built an econometric model to predict sales based on advertising spend, price, competitor activity, and other relevant factors. Now, you need to choose a statistical framework to estimate the model's parameters and make inferences about the impact of advertising.
The Frequentist Path: Classic and Reliable
How it Works: Frequentist econometrics relies on well-established techniques like ordinary least squares regression. You'll get coefficient estimates for each variable (e.g., the average effect of a $1 increase in ad spend on sales), p-values to assess statistical significance, and confidence intervals to provide a range of plausible values.
Strengths: Frequentist methods are widely understood, relatively easy to implement with standard software, and provide a clear framework for hypothesis testing. Their results are grounded in objective probability, based on the long-run frequency of events.
Limitations: Frequentist approaches often assume you have a large dataset. They may struggle with complex models or situations where your data is limited. Additionally, they don't allow for incorporating prior knowledge or beliefs about the parameters.
The Bayesian Route: Flexible and Insightful
How it Works: Bayesian econometrics takes a different approach. You start by expressing your prior beliefs about the model's parameters – for instance, you might expect advertising to have a positive impact on sales. Then, using techniques like Markov Chain Monte Carlo (MCMC), you combine your prior beliefs with the data to obtain a posterior distribution of plausible values for each parameter.
Strengths: Bayesian methods are flexible and can handle complex models and small datasets. They allow you to incorporate prior knowledge, which can be particularly helpful when data is scarce. They also provide a comprehensive quantification of uncertainty, including credible intervals that directly express the probability of parameters falling within a given range.
Limitations: Bayesian analysis can be computationally intensive and requires careful specification of prior distributions, which can introduce subjectivity. The concepts involved may also be less familiar to some audiences, requiring more explanation.
Choosing the Right Path: It Depends!
There's no one-size-fits-all answer to the question of whether to go frequentist or bayesian. The best approach depends on your specific circumstances:
Data: If you have a large, well-structured dataset and a relatively simple model, frequentist methods might be sufficient. For smaller datasets or complex models, Bayesian methods might be more appropriate.
Prior Knowledge: If you have strong prior beliefs about the impact of marketing (e.g., based on previous studies or market research), incorporating those beliefs into a Bayesian analysis could lead to more accurate and informative results.
Goals: If your primary goal is hypothesis testing (e.g., determining whether the advertising effect is statistically significant or whether a creative A is better than a creative B), frequentist methods might be a good choice. If you need a comprehensive understanding of the uncertainty surrounding the estimates or want to incorporate prior knowledge, Bayesian methods might be preferred.
The Bottom Line
Both frequentist and Bayesian approaches offer valuable tools for applying them to your marketing needs. By understanding the strengths and weaknesses of each approach, you can choose the right tool for the job and gain deeper insights into your marketing effectiveness.
In some cases, it can be beneficial to combine both frequentist and bayesian approaches. For example, a frequentist analysis might be used for initial exploration, while a Bayesian approach could be employed for a refined model with improvements.
If you haver reached this point of the newsletter, congratulations! Now you have a new topic of discussion for your fellow marketing or data friends:
Do you feel more like a frequentist or a bayesian?
Tools for Marketing Analytics: PyMC
Let’s discuss briefly about the open source libraries for marketing analytics called PyMC-Marketing and CausalPy.
CausalPy allows you to create quasi-experiments, the best alternative for doing incrementality experiments at scale. It creates counterfactuals (synthetic control methods) using bayesian as well as ordinary least square methods. As explained in their documentation, you can apply a geo experiment approach, a difference in difference which is recommended by many to calibrate MMMs, as well as the Interrupted time series approach, similar to the CausalImpact library from Google Research.
PyMC-Marketing is considered as one of the winners the open source MMM movement and it also includes Customer Lifetime Value estimations. One of the most notable considerations on this methodology is the ability to include time-varying parameters in the MMM. This means we can compute coefficients for each media type that change over time for a more realistic representation of how marketing works. The effect of marketing is not constant and it can change over time. There is also an example here about how to distinguish the effect of two correlated channels including the results of a lift test.
Two great tools for every marketing scientist.
Industry updates and upcoming events
Recent article from Mark Ritson on the value of advertising pre-testing (link), which has been historically a source of debate. He argues that in today’s world, it should be a must. His arguments? As compared to the past, these days ad pre testing has lower costs, faster deliveries and higher predictability.
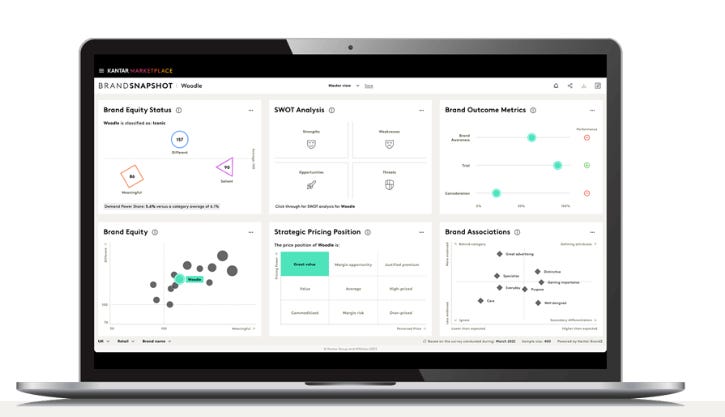
Kantar published their 2024 edition of BrandZ (link). Whereas the methods to assign monetary value to brands is a very nuanced are arguable topic1, the consumer data that informs BrandZ is Kantar’s proven MDS model. Kantar is also offering a free view of many of the data behind this study through their “Brand Equity Snapshot”.
Nielsen launches deduplicated YouTube Connected TV (CTV) campaign measurement in the UK (link). This means that Nielsen will be able to measured the real reach of YouTube campaigns across mobile, desktop and CTV. As CTV has become a more important surface for serving digital advertising, these kinds of developments are a must.
ASI TV Conference to be held in Venice 6th to 8th November 2024 (link). The details of the program are yet to be confirmed, but they will include topics such as measurement, panels and cross media.
Chart of the week
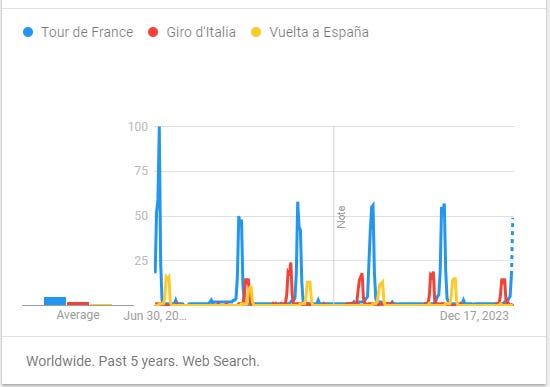
Summer has arrived to Europe, and that means peak cycling season. Here a visually-interesting Google Trends chart in a “3x mountain” shape, very much to the theme.

Oldies but goodies
This time we really go to an oldie to follow up with those that want more on the frequentist vs bayesian discussion. Probability, Frequency and Reasonable Expectation by R. T. Cox (link) is a 1946 article from the American Journal of Physics.
This article explains the differences into understanding probability as a frequency or as a reasonable expectation with a great introduction to the topic and the different views in the traditional statistics literacy. A great summer lecture!
It also produces rather uninteresting results, where the companies with largest market capitalization tend to be also the highest on BrandZ. Seems we could learn much more about branding if we removed that effect.


