The value of descriptive analytics - QN#18


Often marketing analysts spend too much time working for the perfect model. In our pursuit of precision, we, as media measurement specialists, often find ourselves deeply entrenched in the intricacies of advanced modeling. We meticulously fine-tune algorithms, striving for that elusive perfect prediction. We invest countless hours in optimizing parameters and exploring complex statistical techniques, believing that the most sophisticated model will yield the most insightful results.
This is not always the best solution: working on descriptive data could make the point. The reality is that sometimes, less is more. While sophisticated models have their place, we risk overlooking the power of simple, descriptive analysis. Consider this: instead of spending weeks refining a complex model based on three years of data, what if we broadened our scope? By gathering data spanning five or even ten years, we can paint a richer, more comprehensive picture of long-term trends. A well-executed descriptive analysis, focusing on clear visualizations and straightforward metrics, can reveal patterns that are often obscured by the complexity of advanced models.¹

Simple descriptive charts are easy to communicate and tell good stories. Descriptive analyses are incredibly effective in communicating insights to stakeholders. A clear, well-structured chart can be far more accessible and impactful than a complex model output. These visualizations tell compelling stories, enabling us to convey the impact of media strategies in a way that resonates with both technical and non-technical audiences. This storytelling capability is essential for gaining buy-in and driving strategic decisions.
A criticism to this approach could be saying that just by looking at the data we will only find correlation and not causality. However, this concern can be mitigated by our deep understanding of the business landscape. We, as experts, can contextualize the data, explain the underlying mechanisms, and provide compelling narratives that makes the “causality debate” irrelevant. By combining our analytical skills with our business acumen, we can confidently address these criticisms and validate our findings.
The Descriptive First Approach
Before a single regression is run, the best analysts build a simple, descriptive view of how the business has evolved in the area of analysis. When doing a Marketing Model Mix, this means having a full understanding of the media execution and of the evolution of the KPI to model along with evolution of the business and related KPIs. This is the foundation of a successful measurement project that closes the application gap.
Grounding an MMM in Reality: Too many Marketing Mix Models begin with data wrangling and end in a black box. A better process starts with a killer chart. Imagine plotting three years of your total sales, market share, and media spend on a single timeline. This simple view reveals the macro trends that a model focused on short-term variance might miss. It forces a conversation about the business context before the modeling begins, which is essential for avoiding the “insulting recommendations” that are statistically sound but practically useless.
Therefore, as much effort should be put into the right models as in collecting long-term datasets that tell great stories. This is especially true for the long-term effects of media. In conclusion, while advanced modeling remains a valuable tool in our arsenal, we must not neglect the power of descriptive analysis.
The biggest risk in descriptive analysis isn’t the data, it’s the analyst. A compelling chart is a powerful tool, but it can be used to support any narrative. The analyst must choose their role: are they a storyteller, honestly trying to find the clearest narrative the data supports? Or are they a lawyer, cherry-picking data to build a case for a pre-conceived conclusion? We’ve all seen the “7 deadly sins of data-driven marketing” and this is where Pride (using only the data that makes us feel good) and Envy (biasing data to get the results we want) come into play.
An example would be looking for the impact of media into brand metrics. You know the tools: nested models, baseline modeling… That’s the instinct of a seasoned analyst. However, anyone that has seen brand tracking metrics quickly realizes that the variability of this data when looking at 1-2 years is often low and does not tell a great story. Any good modeler should first plot the descriptive data of those brand metrics to see what’s the deal, and very often they are not that exciting. Why spend so my time to find the needle in the haystack, torturing the data to find a subtle pattern? Instead, look at the long term: 5 years is better than 3 years, and why not 10 years? That kind of data will always tell a more interesting story on the brand metrics. And then just overlay the marketing investment across the years: no model, just the metric. If you are lucky you may have found a killer chart just using descriptive data, which will impact 1000 more than a complex nested model looking at 2-3 years of brand metric performance.
The Future is a Human-AI Partnership. Looking at the LLM’s current ability to create code, a next frontier is easily taken with any kind of data analysis, descriptive to begin with. Tools like Gemini, Claude or ChatGPT can act as incredible brainstorming partners, helping an analyst explore hypotheses at lightning speed as well as developing the underlying code to analyze the data. Specialized tools like Julius AI can create visualizations from plain English commands, freeing up the analyst to focus on interpretation, not coding.
AI will not replace the analyst. It will only make the analyst’s strategic judgment more important. The AI can generate a hundred charts, but only a human with deep business context can identify which one is the killer chart—the one that tells the true story and drives the right action. The data point which makes the CFO want to know more and finally have this conversation about budget increases.
What this means, Marketing Leaders?
Hire for Business Acumen: When you build your team, look for analysts who are deeply curious about the business. Technical skills can be taught; strategic thinking and storytelling ability are much harder to find.
Embrace the Co-Pilot Model: Encourage your team to work with AI tools to accelerate their workflow. The goal is to free them from tedious tasks so they can spend more time on what truly matters and provide better guidance for business decisions.
The future of measurement isn’t about abandoning or leaning more into complex models. It’s about keeping a balance. The hunt for the killer chart, grounded in simple, powerful descriptive analysis, is a strong step in this direction. It grounds our work, sharpens our hypotheses, and makes all our subsequent, more complex analyses truly effective.
Find the chart, the combination of metrics or metric growth that will make your audience raise their eyebrows while explaining something obvious
Industry Updates
“The Future of Measurement” Conference by ANA
The USA association of advertisers is organizing a physical/virtual conference about the futre of measurement on September 8-10. You can find more details in this link.
Marketing Week’s “Language of Effectiveness”
The 2025 edition of this research on how advertisers measure marketing is out. In this link there are several articles discussing the key insights of this research partnership of Kantar and Google.
Spanish Effies
The 2025 Effie winners in Spain (jury composition) were announcedd October 23rd in a gala in the the Royal Theather of Madrid. The Grand Prix was awarded to Pikolin, the prize for creative agency was for DDB&14 Group and the prize for media agency was for Link to the full list of winners
Covariate Selection in Causal Inference
When running A/B tests isn’t an option, we have to rely on observational data. But what variables should you control for to estimate a causal effect? This excellent article from Booking.com’s data science team provides a practical guide on “good vs. bad controls.”
It explains how controlling for the wrong variable—like a mediator (a variable on the causal path) or a collider (a common effect)—can introduce significant bias, sometimes even more than omitting a variable. The post offers clear takeaways (e.g., confounding bias is usually worse than collider bias) and rules of thumb for selecting covariates to get more accurate causal estimates from your observational data.
Who cares about Brand Purpose?
A new report from the Ehrenberg-Bass Institute questions the effectiveness of “brand purpose” as a marketing strategy, finding that consumers are mostly unaware of these initiatives.
The study surveyed almost 3,000 consumers in the US, UK, and Australia about 14 “exemplar” purpose-led brands.
Awareness is low: On average, only 18% of consumers could correctly link a brand to its stated purpose.
Guessing is high: The researchers included “dummy” purposes and found an average guessing rate of 9%. This suggests genuine awareness is likely less than 10% for most brands.
Key Takeaway: The report concludes that building awareness for a brand’s purpose is incredibly difficult. It cautions marketers to have realistic expectations, suggesting that if growth is the goal, investing in proven drivers like Mental and Physical Availability is a more reliable strategy.
PyMC Labs compares PyMC-Marketing and Meridian (guess the result?)
For brands choosing an open-source Marketing Mix Modeling (MMM) framework, PyMC Labs has published a technical benchmark comparing their own PyMC-Marketing against Google’s Meridian.
The comparison used synthetic datasets mimicking four scales, from a small “Startup” to a massive “Enterprise” (50+ geos, 30+ channels).
The benchmark concludes PyMC-Marketing is the “more robust choice,” showing advantages in speed, accuracy, and scalability.
Performance: PyMC-Marketing was 2-20x faster and cut the error rate on channel contributions in half compared to Meridian.
Scalability: While both libraries handled smaller datasets, only PyMC-Marketing could successfully run the massive “Enterprise” level dataset; Meridian failed to converge.
Model Fit: PyMC-Marketing consistently produced a better model fit (higher R², lower MAPE) and avoided the systematic errors (autocorrelation) seen in Meridian’s results.
The only area where Meridian had an edge according to this benchmark was in creating smaller model files on disk, though this comes at the cost of sacrificing accuracy and speed.
While the comparison is purely quantitative, the selection of the features in this benchmark will not provide a definitive answer to teams trying to decide. Meridian includes additional features which make it a better fit in many cases not considered in the benchmark.
Meridian excels when using geographical data to add granularity, employing a hierarchical model for a better prediction. Additionally, adding search query volume, reach and frequency metrics provides better modeling capabilities, which were not fully considered in the benchmark. The solutions also differ in their approach to media effect parametrization, seasonality and while both are bayesian approaches, the inclusion of the priors follow a different approach.
Using these features wisely can also give you a higher edge with Meridian so ensure you follow a wholistic approach to decide which framework to use.
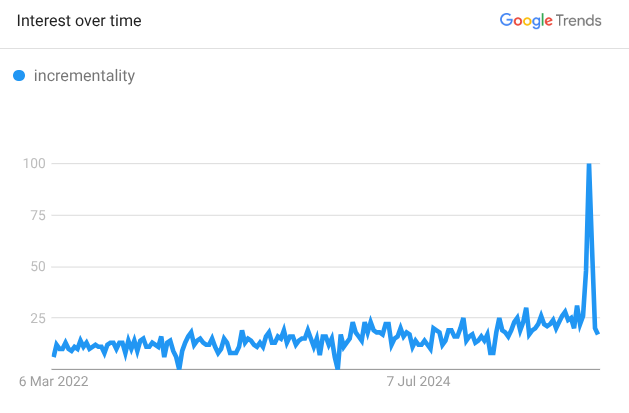
Chart of the week
Incrementality is the latest new word in the trade (link). The average search volume has roughly doubled in the last year with some really big punctual spikes driven.
However, just as MMM is fashionable now but not really new, it’s the same for incrementality! Ben Dutter in LinkedIn made a great reflection on why it’s really paradoxical that after so many years and advances in marketing measurement, we ended up talking about incrementality while it should always have been the core of it. In the end, there have been so many fooled by ROI/ROAS attributed numbers that reading incrementality metrics often requires some preparation.
Oldies but goldies
While this video is pretty recent, it is a great practical summary on what we have been learning about proper brand building over the decades. Mark Ritson’s manners are shocking and make the delivery of his presentations really engaging… But his views are nuanced and not dogmatic. This video summarizes how brands should be built, integrating insights from the different schols of thought.